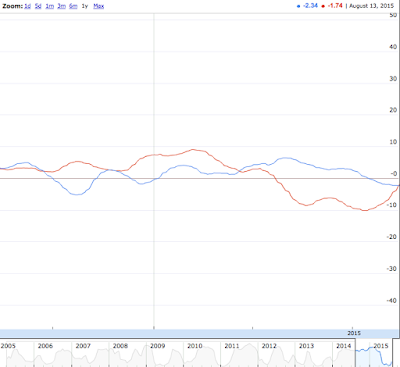
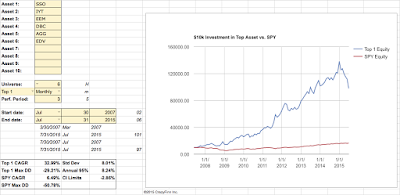
The Simple GMR drawdown is now at a historic -22%, MC GMR -29% and GTCR -37%! This really highlights the importance of a forward-walk/paper-trading to ensure the strategies work in real life and not only when backtested. On a more positive note, Simple Pair Switching switched the allocation to bonds 4 days before the crazy action in the S&P 500 started. TLT is currently down -1.8% from the August 13 switch date, and SPY -5.3%. And as the Modified Dual Momentum strategy indicates, it is currently very hard to find any asset classes that are generating better returns than cash/short term bonds (SHY).
Welcome to QuantHead!
Welcome to QuantHead! I hope you find some interesting ideas here that I've encountered on my journey of learning and share your wisdom with me. Enjoy!
Monday, August 31, 2015
Thursday, August 13, 2015
Simple Pair Switching Update
As of August 13, 2015, the "Simple Pair Switching" strategy has given a signal to switch allocations from stocks to bonds. The return for SPY (SPDR S&P 500 ETF) for the previous period is -0.1%, based on the adjusted close prices of March 23, 2015 and August 13, 2015.
Though not a return to write home about, it's worth noting that TLT (iShares 20+ Year Treasury Bond ETF) would've returned -4.8% for the same period, so the strategy definitely picked the lesser of two evils.
Monday, August 3, 2015
What Works and What Doesn't
It's time for a review of what's working at what's not over the last year.
As you may have noticed, it has not been a great year for most basket rotation strategies I follow.
The exception being "Simple Pair Switching", which between Aug 01, 2014 and Aug 01, 2015 returned a nice +18.69%, with no losing periods. Holding the US stock market (SPY) also returned a nice +9.64% for the same period. Buying the dips is also still working.
What worries me about the following rotation strategies is the depth and length of the drawdowns and volatility compared to the S&P500 index. Looking at the long-term equity curve from a technical analysis perspective also doesn't appear pretty. With the exception of the "Modified Dual Momentum" strategy, it seems like the upward trends of the equity-curves have been violated with a "lower low".
For the monthly rotation strategies I follow, I've presented graphs/stats for a 1 year return, as well as graphs/stats in the larger context, going back before the 2008 financial crisis (except for the "Modified Dual Momentum", for which some of the ETF's didn't exist before 2008). All charts except the "Modified Dual Momentum" strategy are presented courtesy of my "Universal Rotation Strategy Backtesting Tool". Modified Dual Momentum is courtesy of Portfolio Visualizer, though instead of assigning 20% to the 63-day volatility (semi-variance), which was not included as an option, I used 2-month return.
Simple GMR
CAGR: -14.59%
Max DD: -21.13%
Global Market Rotation
CAGR: -14.01%
Max DD: -20.18%
Global Transportation with Commodities
CAGR: -14.31%
Max DD: -29.21%
Modified Dual Momentum
CAGR: 2.97%
Max DD: -11.28%
Subscribe to:
Posts (Atom)


